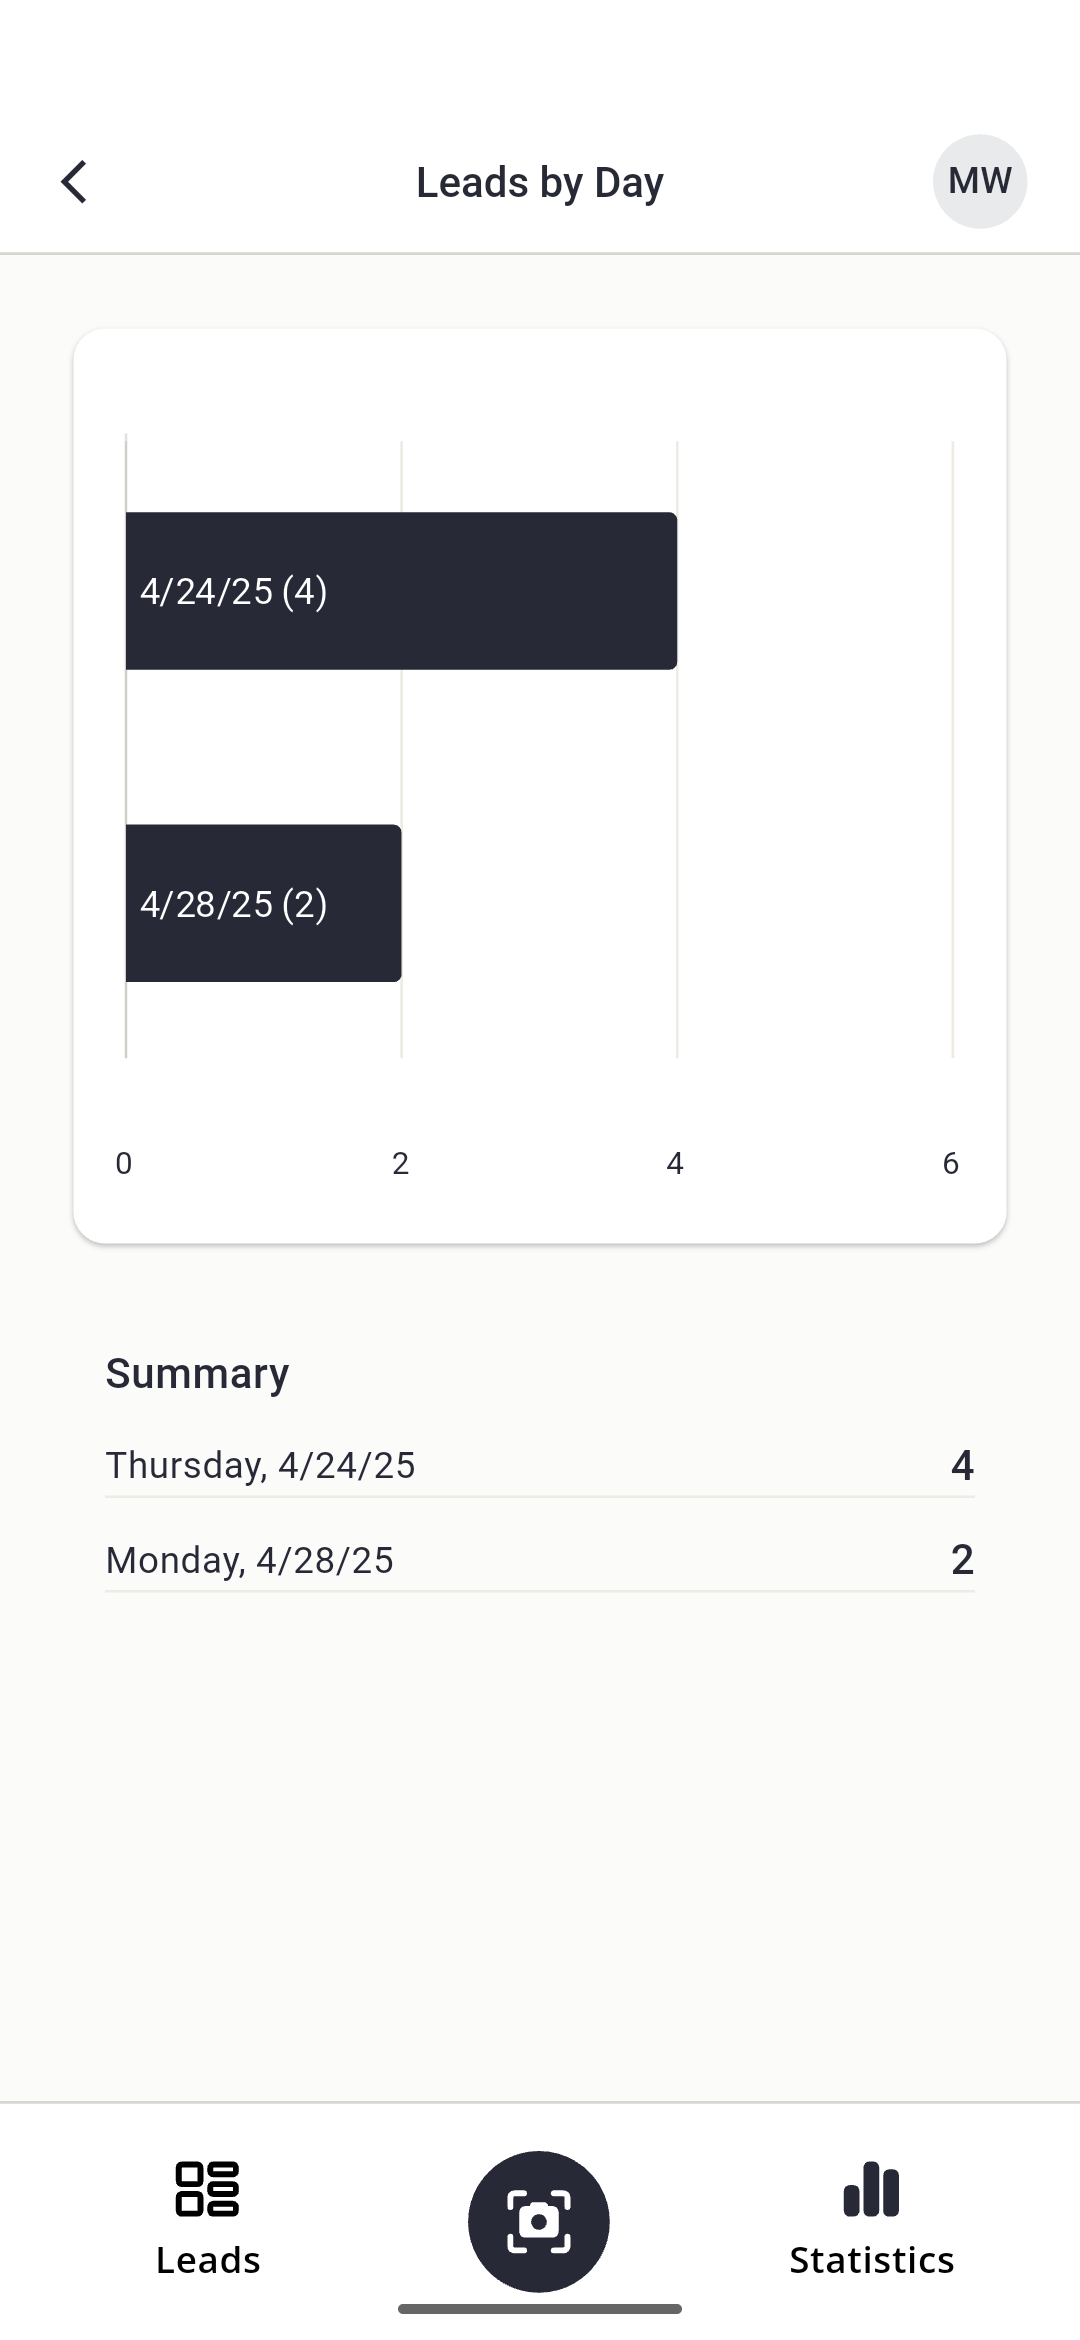
- The chart displays bars to represent the number of leads collected per date, sorted from highest to lowest.
- The summary below the chart lists each date alongside its lead count, sorted chronologically. For example, 'Tuesday, 11/19/24: 8' means 8 leads were collected on that date.
Booth staff can view quick statistics and onsite insights about their lead data by selecting the Statistics option in the bottom menu. These details are scoped to the individual staff member, so each person can only view statistics for their leads. Booth-level lead and scan data reports are available to the booth admin in the Lead Capture Exhibitor Portal.
Statistics are organized into four categories:
- Leads by Day: View the number of leads captured on each date.
- Rating: See lead distribution by star rating.
- Tags: Track how leads are categorized using tags.
- Questions: Analyze responses to custom questions.
To explore detailed statistics for any category, simply tap its title.
Leads by Day
This screen displays how many leads were collected on specific dates.
Rating
This screen shows the distribution of star ratings across your leads.
- The chart displays bars representing the number of leads for each rating category, sorted from most to least common.
- The summary lists each rating category and its corresponding lead count, in descending order (5 Stars, 4 Stars, 3 Stars, etc.).
- No Rating indicates leads that haven't been assigned a rating.

Tags
This screen categorizes your leads based on assigned tags.
- The chart displays bars representing the number of leads for each tag, sorted from most to least selected.
- The summary lists each tag with its corresponding lead count, matching the order shown on the Lead Details screen.
- No Tag Selected indicates leads that haven’t been assigned any tags.

Questions
This screen analyzes responses to your custom questions. Select a question from the dropdown menu to view its statistics.
- The chart displays bars representing the number of leads for each response option, sorted from most to least selected.
- The summary lists each response option with its corresponding lead count, matching the order shown on the Lead Details screen.
- No Response indicates leads that do not have responses to the selected question.

Last modified Nov 17, 2025
Was this article helpful?
That’s Great!
Thank you for your feedback
Sorry! We couldn't be helpful
Thank you for your feedback
Feedback sent
We appreciate your effort and will try to fix the article